
Report Builder 3.0 in SQL Server
Report Builder 3.0 is a report authoring tool from Microsoft for business users. It has a simple user interface that is quite similar to MS Office.
In report builder, when you design a report, that time you specify or mention from where to get the data i.e. source, which data to get i.e. type, and how to display or show the data i.e. UI or look and feel.
When we run the report, then the report processor inputs all the information you have specified, retrieves data, & combines it with the report’s required layout to create the report. You can preview or publish the reports in this Report Builder tool.
Benefits of Report Builder
1. One of the benefits of report builder is that we can create a report with table, chart, matrixes & free-form report layouts.
2. We can build a report using any data source type that has MS .NET’s Framework managed data, OLE DB provider or ODBC data source.
3. By using Report Builder, we can update the reports which were created in Business Intelligence Development Studio Report Designer environment.
4. It can be used to add interactive features to show reports in customized view like document maps, show or hide buttons & drill-through links to sub-reports.
5. Report builder can be used to modify or update data by adding filters, groups & sorting of data and by using expressions or formulas.
6. It can be used to embed/reference images and other resources like external content.
Example of Creating a Report with Report Builder
Below example will cover creating a Report Builder Table with the help of wizard.
Using the ‘Getting Started dialog’, launch the Table/Matrix Wizard by Selecting ‘Table or Matrix’ Wizard. Then choose dataset:

The default behavior of this is to use an already existing shared dataset. Select one dataset from dataset list or click Browse button to search for the one we want.
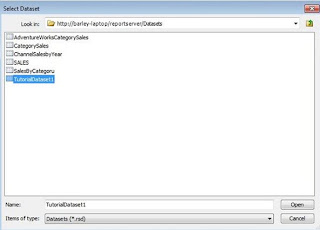
For choosing your own created dataset, Click ‘Browse’ button and locate the desired folder where you saved it & select the dataset and click Open:
You will return to the ‘Choose Dataset’ dialog. Click Next to continue with the ‘Arrange fields’ dialog. Fill in the prompted dialog as shown below:
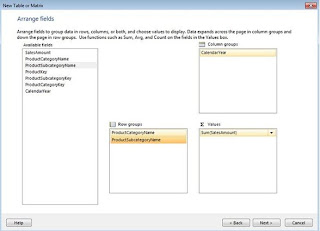
The ‘Arrange Fields’ dialog has 3 areas for us to drag & drop fields from the already Available Fields list i.e. Row groups, Column groups & Values.
The Column groups are spread over across the page & Row groups are spread down the page & Values got placed at the point of intersection of rows & columns. These above choices provide us a simple matrix-type report or otherwise for getting a tabular form report, drag & drop all of the required columns into the Values list. Click ‘Next’ and fill in the dialog as shown below:

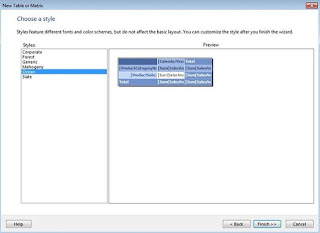
As we have changed the selection of radio button under ‘Show subtotals and grand totals’ checkbox (refer above screenshot), the layout will update itself to reflect as per our choice. Click ‘Next’ to the ‘Style’ dialog. Select one of the styles as selected below:
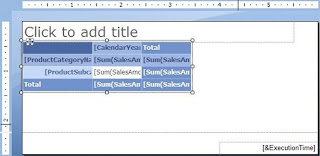
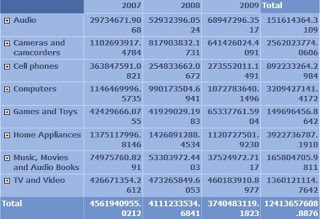
Click on ‘Finish’ to complete the steps. We have created the following report:
Click ‘Run’ to preview the report:
We can save this report to our local drive. Click the diskette icon at the top or click ‘Save’ button from the Report Builder’s menu and then locate the desired folder.
Report Builder 3.0 is a report authoring tool from Microsoft for business users. It has a simple user interface that is quite similar to MS Office.
In report builder, when you design a report, that time you specify or mention from where to get the data i.e. source, which data to get i.e. type, and how to display or show the data i.e. UI or look and feel.
When we run the report, then the report processor inputs all the information you have specified, retrieves data, & combines it with the report’s required layout to create the report. You can preview or publish the reports in this Report Builder tool.
Benefits of Report Builder
1. One of the benefits of report builder is that we can create a report with table, chart, matrixes & free-form report layouts.
2. We can build a report using any data source type that has MS .NET’s Framework managed data, OLE DB provider or ODBC data source.
3. By using Report Builder, we can update the reports which were created in Business Intelligence Development Studio Report Designer environment.
4. It can be used to add interactive features to show reports in customized view like document maps, show or hide buttons & drill-through links to sub-reports.
5. Report builder can be used to modify or update data by adding filters, groups & sorting of data and by using expressions or formulas.
6. It can be used to embed/reference images and other resources like external content.
Example of Creating a Report with Report Builder
Below example will cover creating a Report Builder Table with the help of wizard.
Using the ‘Getting Started dialog’, launch the Table/Matrix Wizard by Selecting ‘Table or Matrix’ Wizard. Then choose dataset:
The default behavior of this is to use an already existing shared dataset. Select one dataset from dataset list or click Browse button to search for the one we want.
For choosing your own created dataset, Click ‘Browse’ button and locate the desired folder where you saved it & select the dataset and click Open:
You will return to the ‘Choose Dataset’ dialog. Click Next to continue with the ‘Arrange fields’ dialog. Fill in the prompted dialog as shown below:
The ‘Arrange Fields’ dialog has 3 areas for us to drag & drop fields from the already Available Fields list i.e. Row groups, Column groups & Values.
The Column groups are spread over across the page & Row groups are spread down the page & Values got placed at the point of intersection of rows & columns. These above choices provide us a simple matrix-type report or otherwise for getting a tabular form report, drag & drop all of the required columns into the Values list. Click ‘Next’ and fill in the dialog as shown below:
As we have changed the selection of radio button under ‘Show subtotals and grand totals’ checkbox (refer above screenshot), the layout will update itself to reflect as per our choice. Click ‘Next’ to the ‘Style’ dialog. Select one of the styles as selected below:
Click on ‘Finish’ to complete the steps. We have created the following report:
Click ‘Run’ to preview the report:
We can save this report to our local drive. Click the diskette icon at the top or click ‘Save’ button from the Report Builder’s menu and then locate the desired folder.